Fallstreaks


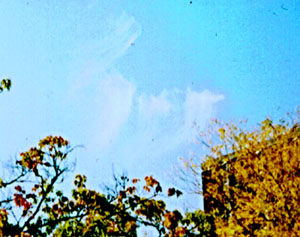
The clouds in the image above are fallstreaks, or, as coined by sailors of old, mares' tails. They are fibrous, hooked-shaped clouds that are composed of ice. Although not uncommon, the fallstreak is somewhat of an intriguing mystery. How do they form? Why do they take a peculiar shape? What can they tell us about the air surrounding them?
The formation of the fallstreak begins with an updraft which lifts parcels of air to the point where net condensation occurs within the parcels–the result is a cloud. Within this cloud, particles of ice begin to form from supercooled water droplets. As the crystals grow in size, they become too heavy to be supported by the updraft or the updraft dissipates and they begin to fall. The particles falling from the cloud compose the "tail" of the fallstreak. These particles fall at near their terminal speed, whilst in the horizontal direction, they travel nearly at the speed of the local wind. Since the horizontal wind decelerates with decreasing altitude, the speed of the particles in the horizontal diminishes as they fall.
You may wonder why these clouds have the interesting hook shape to them. The answer can be found in a simple physics problem–with a twist.
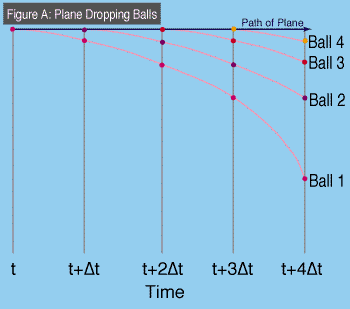
 Consider an aircraft flying at a constant velocity, level to
the ground,
as shown in Figure A. Suppose this aircraft drops balls at constant intervals
in its flight. Neglecting drag, the balls will follow parabolic paths defined
mathematically by the constant speed in the horizontal and by the
acceleration due to gravity. If you draw a line connecting the balls dropped
at successive time intervals, depicted by Figure A, you end up with a
straight line.
Now, you may be wondering what this has to do with
fallstreaks: they
are parabolic, not linear. The twist to this analogy is due to two assumptions
made in the aircraft scenaro: the balls accelerate in the vertical and
maintain a constant speed in the horizontal during their fall. If you recall the
conditions of fallstreak formation, the vertical speed is constant and the
horizontal speed changes.
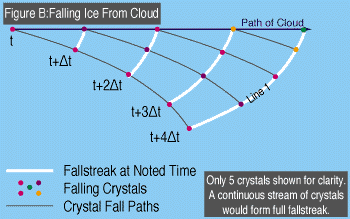
 So, how does replacing the plane in Figure A with a cloud and
reversing the horizontal and vertical velocity assumptions change the
scenario? The cloud will be moving at a constant velocity with the ice
particles dropping at a constant speed in the vertical and slowing down in
the horizontal. The result? Figure B describes what happens under these
conditions. As line 1 shows, the resultant figure is that of a hook. This
extraordinary shape is the signature of a fallstreak.
In addition to its interesting shape, the fallstreak provides
a method
for us to read the sky. Specifically, it allows us to determine whether the
local area is experiencing warm or cold advection. A fallstreak is a
representation of a shear vector--the mathematical difference between
wind velocity at different altitudes. In this case, the shear arises from the
difference between wind velocity at the top and the bottom of the layer of air
in which the fallstreak exists. In addition, this vector defines the horizontal
temperature gradient of the layer.
The temperature information of the fallstreak layer is half
the
information you need to determine temperature advection; the other half is
the direction of the wind. By watching the fallstreak and any other
surrounding clouds, you can determine just which way the wind is blowing.
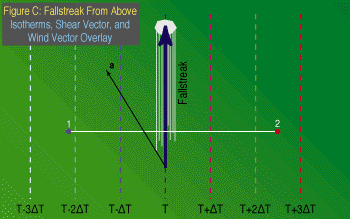
In Figure C, a represents the direction of the observed wind
flow.
What this amounts to is that the air will move in the direction that the wind
vector is pointing. If the air moves toward the side of the streak with higher
temperatures, then there is cold advection, and vice-versa. In this case, the
vector is pointing towards colder air, thus there is warm advection in the
fallstreak layer.
While the estimation of the shear and wind vector are far
from
precise, you can see that the ability to read the sky and clouds can provide
basic information about the state of the atmosphere in your area.
Reading the Sky
 Utilizing this information about shear vectors and
fallstreaks, consider
a vector oriented over the fallstreak as shown in Figure C. The dotted lines
represent approximated isotherms on each side of the streak. Note that
there is a temperature rise when you follow the path from Point 1 to Point 2.
Conclusion
Many people are left in awe by the power of the weather: thunderstorms, tornadoes, and hurricanes for example.
But the atmosphere can be intriguing without being destructive. This can be seen in the delicate structure and peculiar shape that makes the fallstreak a spectacular display of the laws of physics.
Rogers, R.R., and M.K. Yau, 1989. A Short Course in Cloud Physics. Elsevier Science Inc. Tarrytown, NY.
Bohren, C.F., and A.B. Fraser, 1992. Fall Streaks: Parabolic Trajectories With a Twist. American Journal Physics, 60, 1030-1033.
Alistair B. Fraser, Meteorological Observations Classnotes (University Park, PA, ©1995)